wide column stores
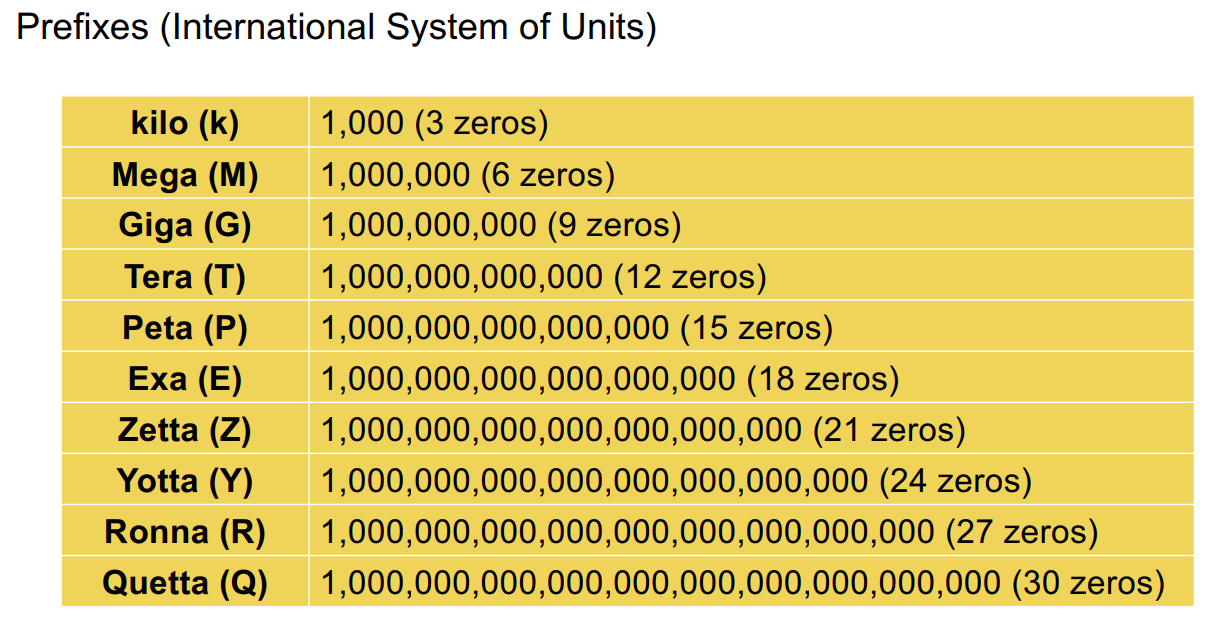
Wide column stores were invented to provide more control over performance and in particular, in order to achieve high-throughput and low latency for objects ranging from a few bytes to about 10 MB, which are too big and numerous to be efficiently stored as so-called clobs (character large objects) or blobs (binary large objects) in a relational database system, but also too small and numerous to be efficiently accessed in a distributed file system.
Why wide column stores
A wide column store will be more tightly integrated with the parallel data processing systems.
wide column stores have a richer logical model than the simple key-value model behind object storage. wide column stores also handle very small values (bytes and kBs) well thanks to batch processing.
different from RDBMS
It does not have any data model for values, which are just arrays of bytes; since it efficiently handles values up to 10 MB, the values can be nested data in various formats, which breaks the first normal form; tables do not have a schema; there is no language like SQL, instead the API is on a lower level and more akin to that of a key-value store; tables can be very sparse, allowing for billions of rows and millions of columns at the same time; this is another reason why data stored in HBase is denormalized.
BigTable and HBase
Rationale
HBase is an open-source equivalent to the BigTable as part of the Hadoop ecosystem.
The data model of HBase is based on the realization that joins are expensive, and that they should be avoided or minimized on a cluster architecture.
The second design principle underlying HBase is that it is efficient to store together what is accessed together. In the big picture, this is a flavor of batch processing, one of the overarching principles in Big Data. Batch processing reduces the impact of latency.
Tables and row IDs
From an abstract perspective, HBase can be seen as an enhanced keyvalue store, in the sense that:a key is compound and involves a row, a column and a version;values can be larger (clobs, blobs), up to around 10 MB; keys are sortable.
A row ID is logically an array of bytes, although there is a library to easily create row ID bytes from specific primitive values. In HBase, the key identifying every cell consists of: the row ID, the column family, the column qualifier, the version.
Column families
The other attributes, called columns, are split into so-called column families. This is a concept that does not exist in relational databases and that allows scaling the number of columns.
Column qualifiers
Columns in HBase have a name (in addition to the column family) called column qualifier, however unlike traditional RDBMS, they do not have a particular type. Column qualifiers are arrays of bytes (rather than strings), and as for row IDs, there is a library to easily create column qualifiers from primitive values. Unlike the values which can be large arrays of bytes (blobs), it is important to keep column families and column qualifiers short, because as we will see, they are repeated a gigantic number of times on the physical layer.
Versioning
HBase generally supports versioning, in the sense that it keeps track of the past versions of the data. As we will see, this is implemented by associating any value with a timestamp, also called version, at which it was created (or deleted).Users can also override timestamps with a value of their choice to have more control about versions.
Logical queries
HBase supports four kinds of low-level queries: get, put, scan and delete. Unlike a traditional key-value store, HBase also supports querying ranges of row IDs and ranges of timestamps.
HBase offers a locking mechanism at the row level, meaning that different rows can be modified concurrently, but the cells in the same row cannot: only one user at a time can modify any given row.
Physical architecture
Partitioning
A table in HBase is physically partitioned in two ways: on the rows and on the columns. The rows are split in consecutive regions. Each region is identified by a lower and an upper row key, the lower row key being included and the upper row key excluded. A partition is called a store and corresponds to the intersection of a region and of a column family.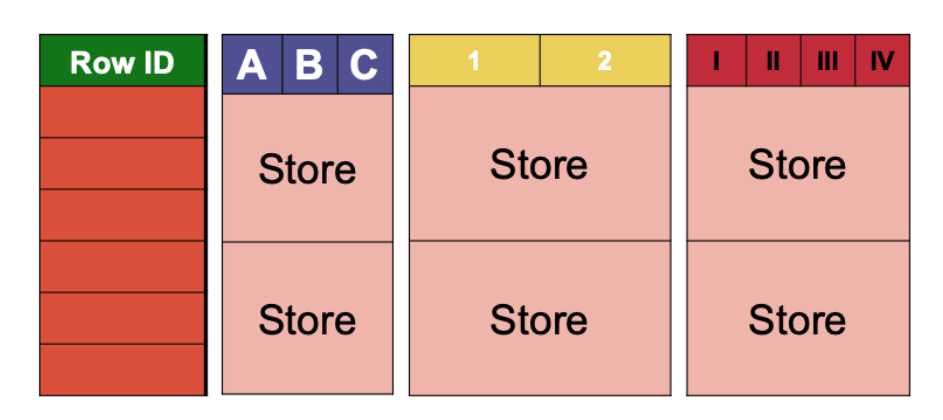
Network topology
HBase has exactly the same centralized architecture as HDFS. The HMaster and the RegionServers should be understood as processes running on the nodes, rather than the nodes themselves. The HMaster assigns responsibility of each region to one of the RegionServers. There is no need to attribute the responsibility of a region to more than one RegionServer at a time because, as we will see soon, fault tolerance is already handled on the storage level by HDFS. If a region grows too big, for example because of many writes in the same row ID interval, then the region will be automatically split by the responsible RegionServer. If a RegionServer has too many regions compared to other RegionServers, then the HMaster can reassign regions to other RegionServers.
Physical storage
The store is, physically, nothing less than a set of cells. Each cell is thus handled physically as a key-value pair where the key is a (row ID, column family, column qualifier, version) tuple. All the cells within a store are eventually persisted on HDFS, in files that we will call HFiles.
An HFile is, in fact, nothing else than a (boring) flat list of KeyValues, one per cell. What is important is that, in an HFile, all these KeyValues are sorted by key in increasing order, meaning, first sorted by row ID, then by column family (trivially unique for a given store), then by column qualifier, then by version (in decreasing order, recent to old). This means that all versions of a given cell that are in the same HFile are located together, and one of the cells (within this HFile) is the latest. If we zoom in at the bit level, a KeyValue consists in four parts: The length of the keys in bits (this length is encoded on a constant, known number of bits) • The length of the value in bits (this length is encoded on a constant, known number of bits) • The actual key (of variable length) • The actual value (of variable length). Why do we not just store the key and the value? This is because their length can vary. If we do not know their length, then it is impossible to know when they stop just looking at the bits.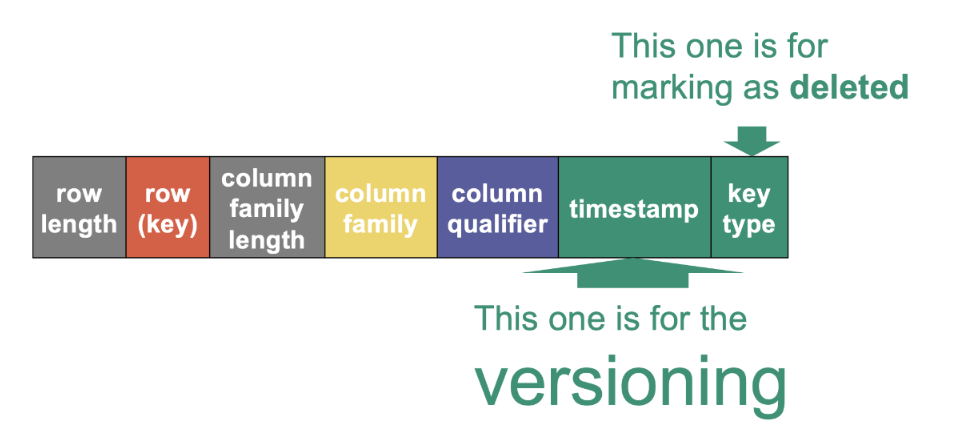
KeyValues, within an HFile, are organized in blocks. But to not confuse them with HDFS blocks, we will call them HBlocks. HBlocks have a size of 64 kB, but this size is variable: if the last KeyValue goes beyond this boundary, then the HBlock is simply longer and stops whenever the last KeyValue stops. The HFile then additionally contains an index of all blocks with their key boundaries. This separate index is loaded in memory prior to reading anything from the HFile.
Log-structured merge trees
When accessing data, HBase needs to generally look everywhere for cells to potentially return: in every HFile, and in memory. As long as there is room in memory, freshly created cells are added in memory. At some point, the memory becomes full (or some other limits are reached). When this happens, all the cells need to be flushed to a brand new HFile. Upon flushing, all cells are written sequentially to a new HFile in ascending key order, HBlock by HBlock, concurrently building the index structure. When cells are added to memory, they are added inside a data structure that maintains them in sorted order (such as tree maps) and then flushing is a linear traversal of the tree.
What happens if the machine crashes and we lose everything in memory? We have a so-called write-ahead-log for this. Before any fresh cells are written to memory, they are written in sequential order (append) to an HDFS file called the HLog. There is one HLog per RegionServer. A full write-ahead-log also triggers a flush of all cells in memory to a new HFile. If there is a problem and the memory is lost, the HLog can be retrieved from HDFS and “played back” in order to repopulate the memory and recreate the sorting tree structure.
After many flushes, the number of HFiles to read from grows and becomes impracticable. For this reason, there is an additional process called compaction that takes several HFiles and outputs a single,merged HFile. Since the cells within each HFile are already sorted, this can be done in linear time, as this is essentially the merge part of the merge-sort algorithm. Compaction is not done arbitrarily but follows a regular, logarithmic pattern. When the memory is flushed again, an standard-size HFile is written and the two standard-size HFiles are immediately compacted to a double-size HFile.
Additional design aspects
Bootstrapping lookups
In order to know which RegionServer a client should communicate with to receive cells corresponding to a specific region, there is a main, big lookup table that lists all regions of all tables together with the coordinates of the RegionServer in charge of this region as well as additional metadata.
Caching
In order to improve latency, cells that are normally persisted to HFiles (and thus no longer in memory) can be cached in a separate memory region, with the idea of keeping in the cache those cells that are frequently accessed.
Bloom filters
HBase has a mechanism to avoid looking for cells in every HFile. This mechanism is called a Bloom filter. It is basically a black box that can tell with absolute certainty that a certain key does not belong to an HFile, while it only predicts with good probability (albeit not certain) that it does belong to it.
Data locality and short-circuiting
When a RegionServer flushes cells to a new HFile, a replica of each (HDFS) block of the HFile is written, by the DataNode process living on the same machine as the RegionServer process, to the local disk. This makes accessing the cells in future reads by the RegionServer extremely efficient, because the RegionServer can read the data locally without communicating with the NameNode: this is known as short-circuiting in HDFS.
using Habse
After installing Hbase, we can use Hbase shell. There are some commands in hbase shell: get, scan.
We can use filters with scan to query and filter data.
exercises
bloom filter
perfect hash function should have uniform probability.
all hash functions set a bit to 1 = collide at the same place: probability of a FP case
deleting only happens when compacting.
references
https://ghislainfourny.github.io/big-data-textbook/
https://datakaresolutions.com/hbase-quick-guide-to-key-commands/
https://www.datapotion.io/blog/hbase-shell-column-filters/
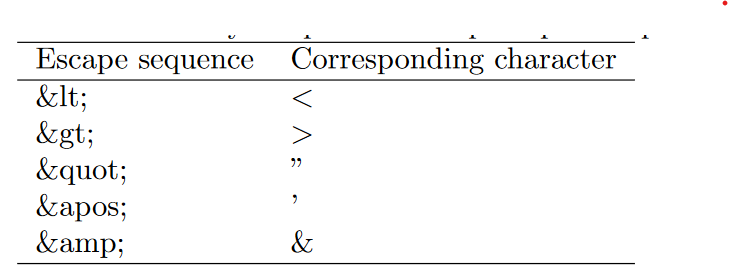 . Escape sequences can be used anywhere in text, and in attribute values. At other places (element names, attribute names, inside comments), they will not be recognized.